Capturing the "Truth" of Earthquakes
The New Seismology Forged by Over a Decade of Theoretical Development
Overcoming the "Limits" of Seismology
What exactly happens deep underground the moment an earthquake strikes? We estimate the answer from the shaking (seismic waves) observed on the surface. However, for a long time, earthquake analysis methods were built on an "unreasonable premise": the assumption that "the underground structure is perfectly known."
We cannot directly see underground. Even slight discrepancies in the assumed underground structure can severely distort the calculated earthquake image. Yet, in conventional analyses, this uncertainty was simply ignored.
Acknowledging the "Unknown" from the Start
In 2011, we completely shifted our perspective.
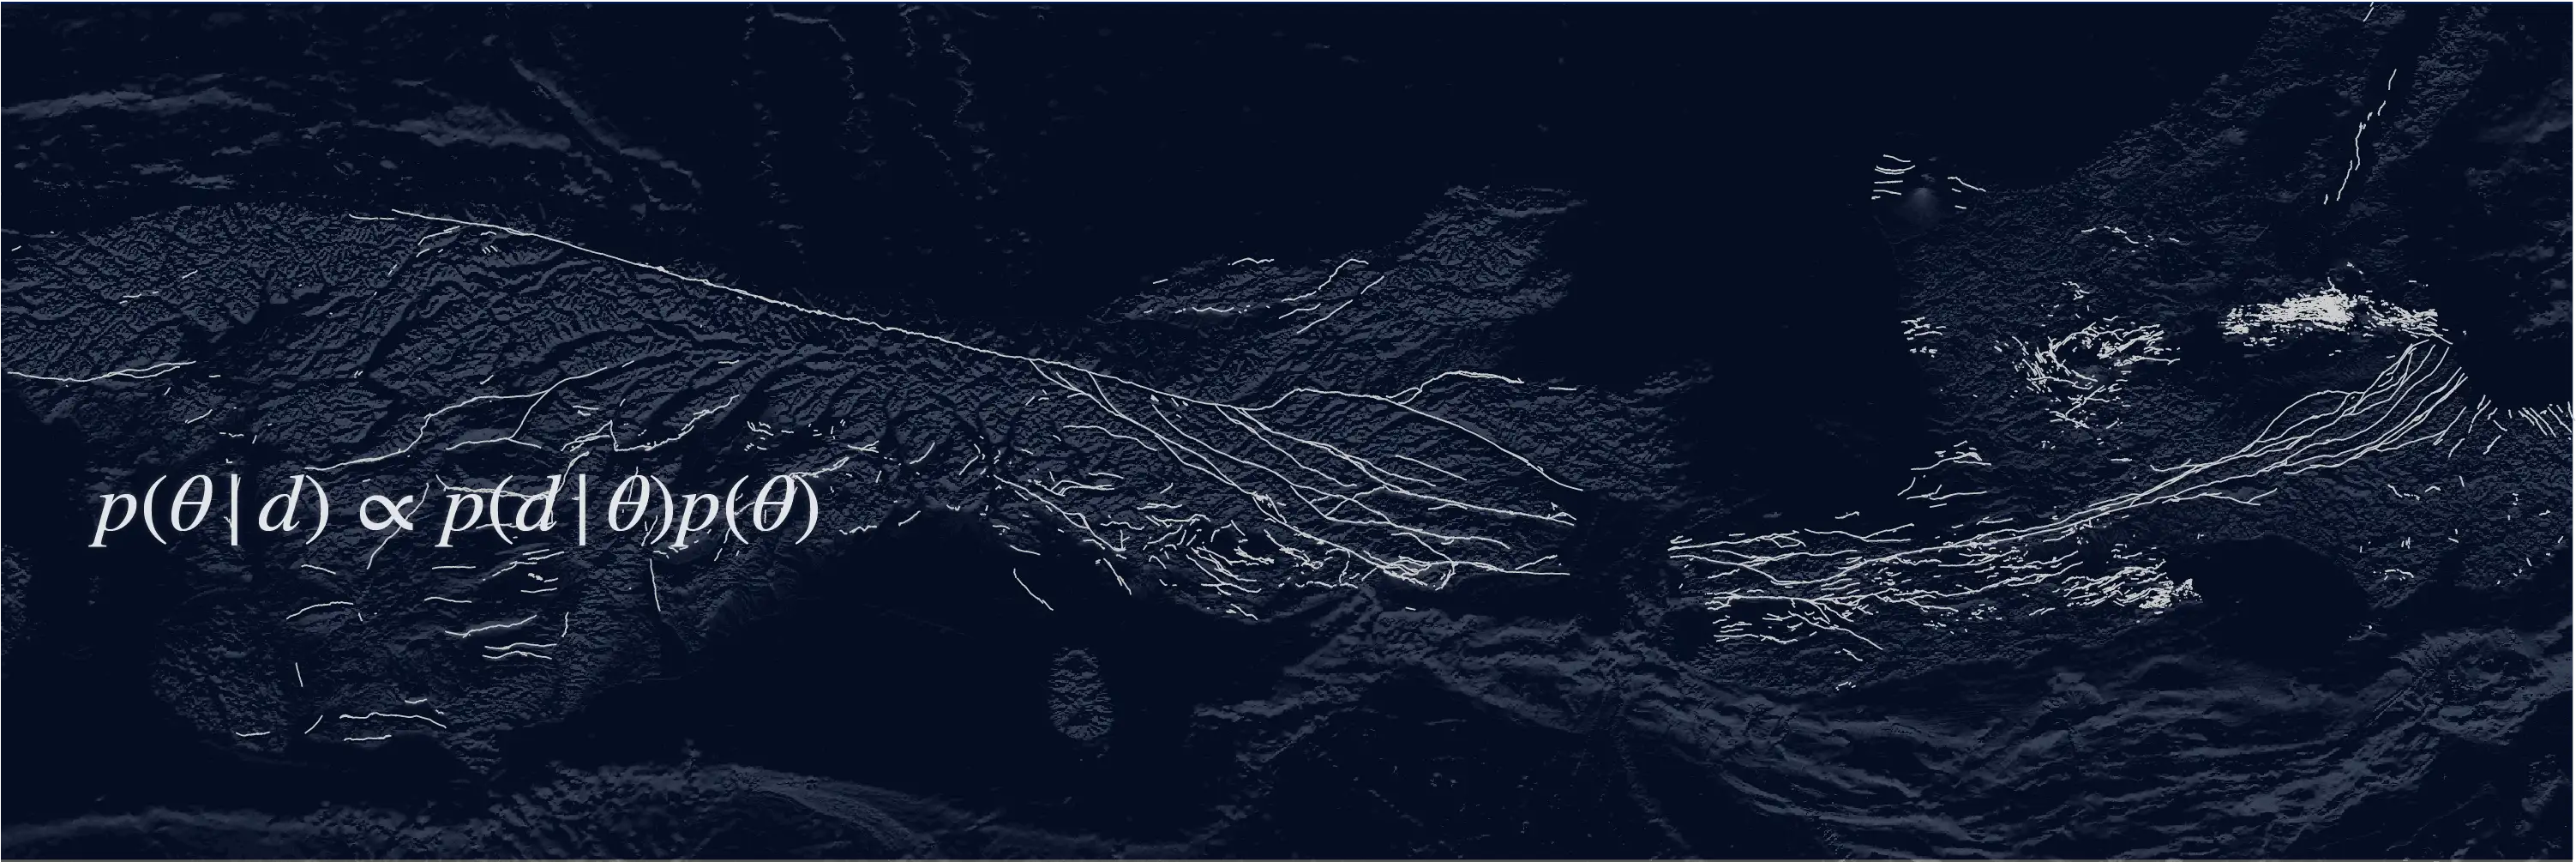
If the underground structure is unknown, we should build that "uncertainty" directly into our calculations from the beginning.
This concept (Yagi and Fukahata, 2011) enabled stable estimation of fault slip without being misled by noise. Even for the massive 2011 Tohoku-Oki earthquake, we were able to depict the subsurface phenomena with unprecedented reliability.
DOI: 10.1111/j.1365-246X.2011.05043.x (Yagi and Fukahata, 2011)
Evolution of Analytical Theory: Comparison for the 2011 Tohoku-Oki Earthquake
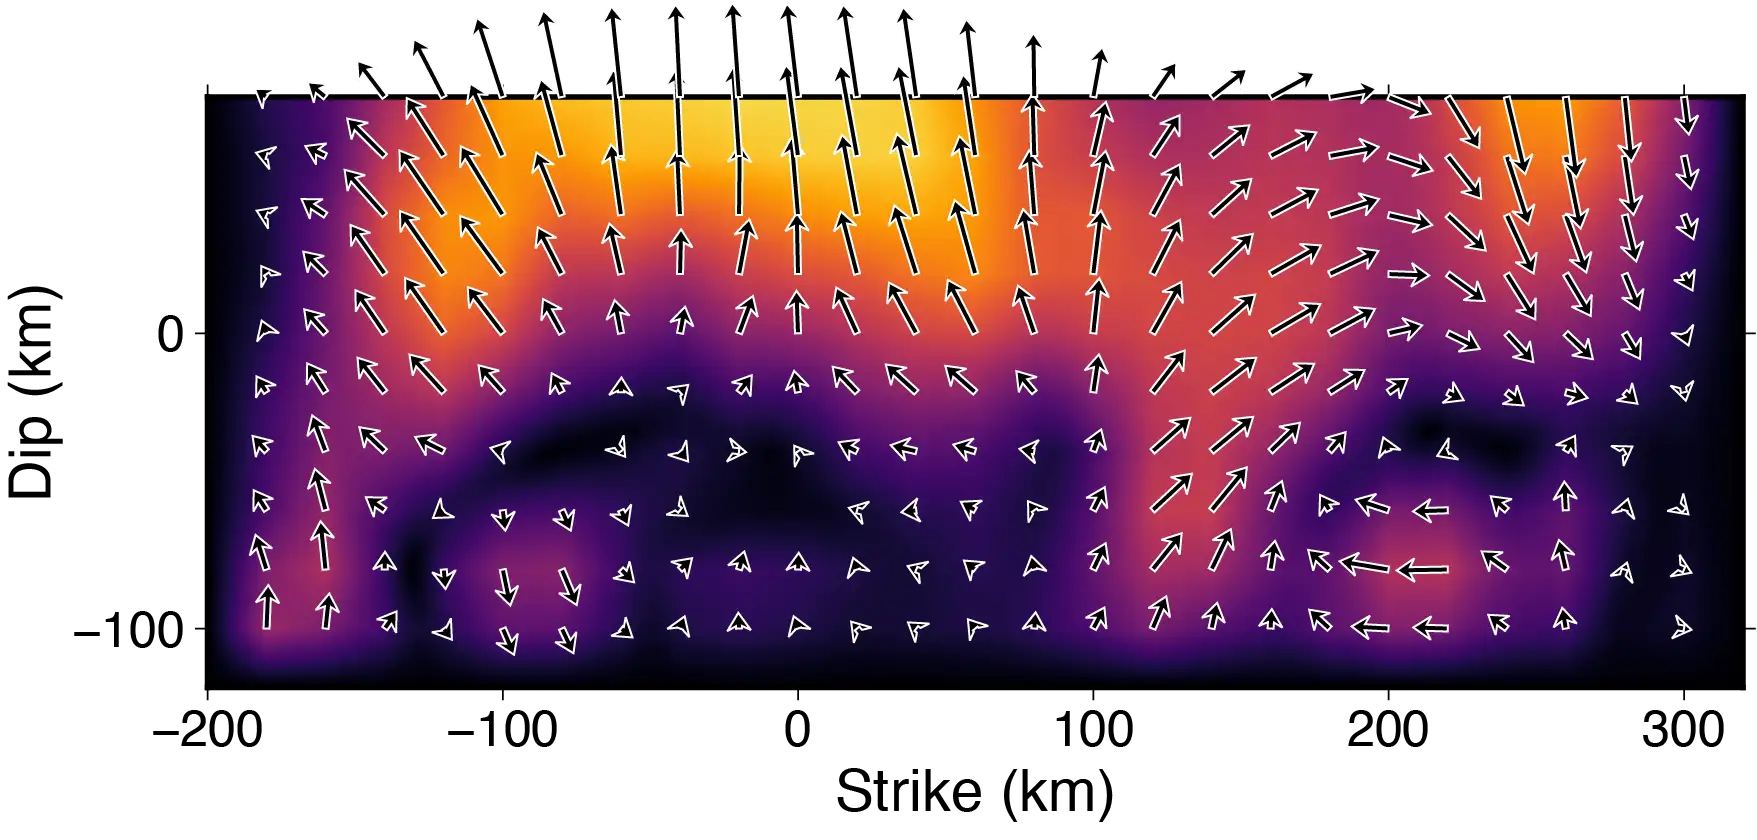
Structural uncertainties appear as "unnatural normal-faulting slip (artifacts)," burying the true image in noise.
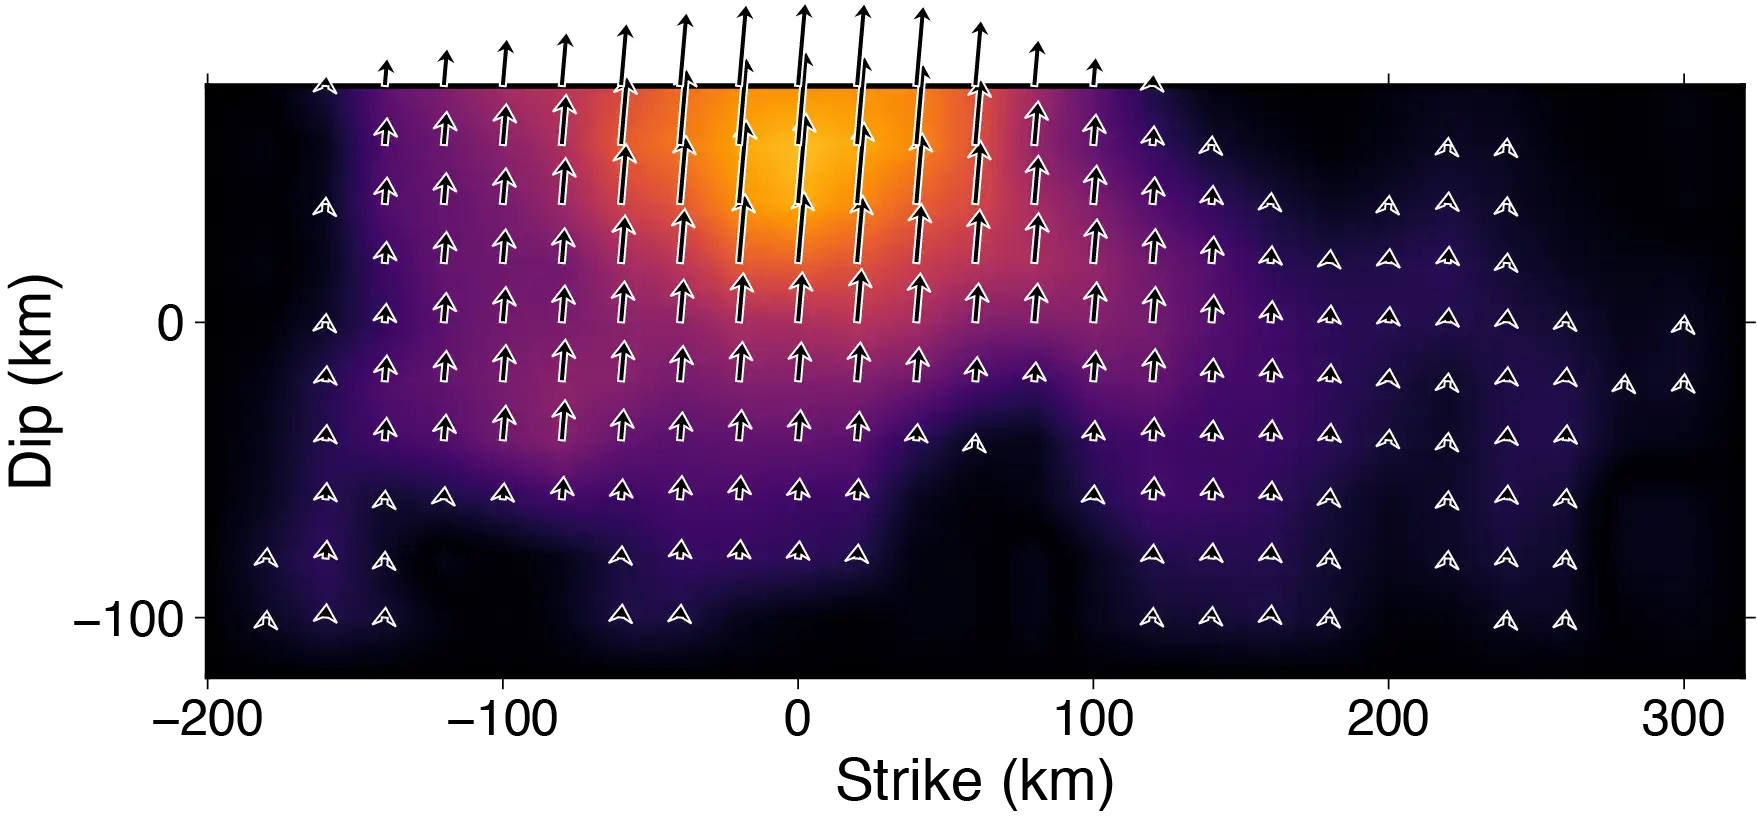
By incorporating uncertainty into the calculation, noise is removed, and the main rupture area clearly emerges.
"Noise" or "Reality"? The complex patterns and backward slip (normal faulting) seen in the left figure are actually calculation errors—stemming from unknown underground structures—misinterpreted as actual fault slip. Conventional methods tried to fix this by forcefully restricting the slip direction. In contrast, by not ignoring this "error" and treating it properly with statistics, we succeeded in obtaining a highly reliable source image as shown on the right (Yagi and Fukahata, 2011).
*Note: In conventional methods, results can change significantly just by altering how the error variance at each station is set (e.g., keeping it constant vs. scaling it to the maximum amplitude).
I will never forget the moment when, after countless trials and errors, we arrived at this idea and a clear image emerged from the noise. This research paved the way for flexible source models. "Reframing the question" can dramatically change how we see the world. That excitement remains the driving force of my research.
Yuji Yagi
Finding Meaning in What Was Dismissed as "Error"
The next wall we faced was the geometry of the fault itself. Real faults are not smooth, flat planes. They bend, curve, and have bumps. Historically, the effects of these complexities were treated merely as "modeling errors." But we thought differently:
This is not an "error." We should be able to extract the actual shape of the fault from this data.
This realization gave birth to the method by Shimizu, Yagi et al. (2020).
Freeing Faults from the "Plane" — PDTI
Today, our journey has led us to PDTI (Potency Density Tensor Inversion). PDTI is an analytical method that discards the assumption of "slip occurring on a pre-defined flat plane," allowing us to capture subsurface deformation in its true, unrestrained form.
As a result, we can now visualize phenomena like the following with astonishing clarity:
- The realistic geometry of complex, bending faults
- Peculiar earthquakes where the rupture front returns like a boomerang
- Source images that initially appear "bizarre" but reflect physical reality
3D Visualization of Fault Geometry and Slip Distribution using PDTI
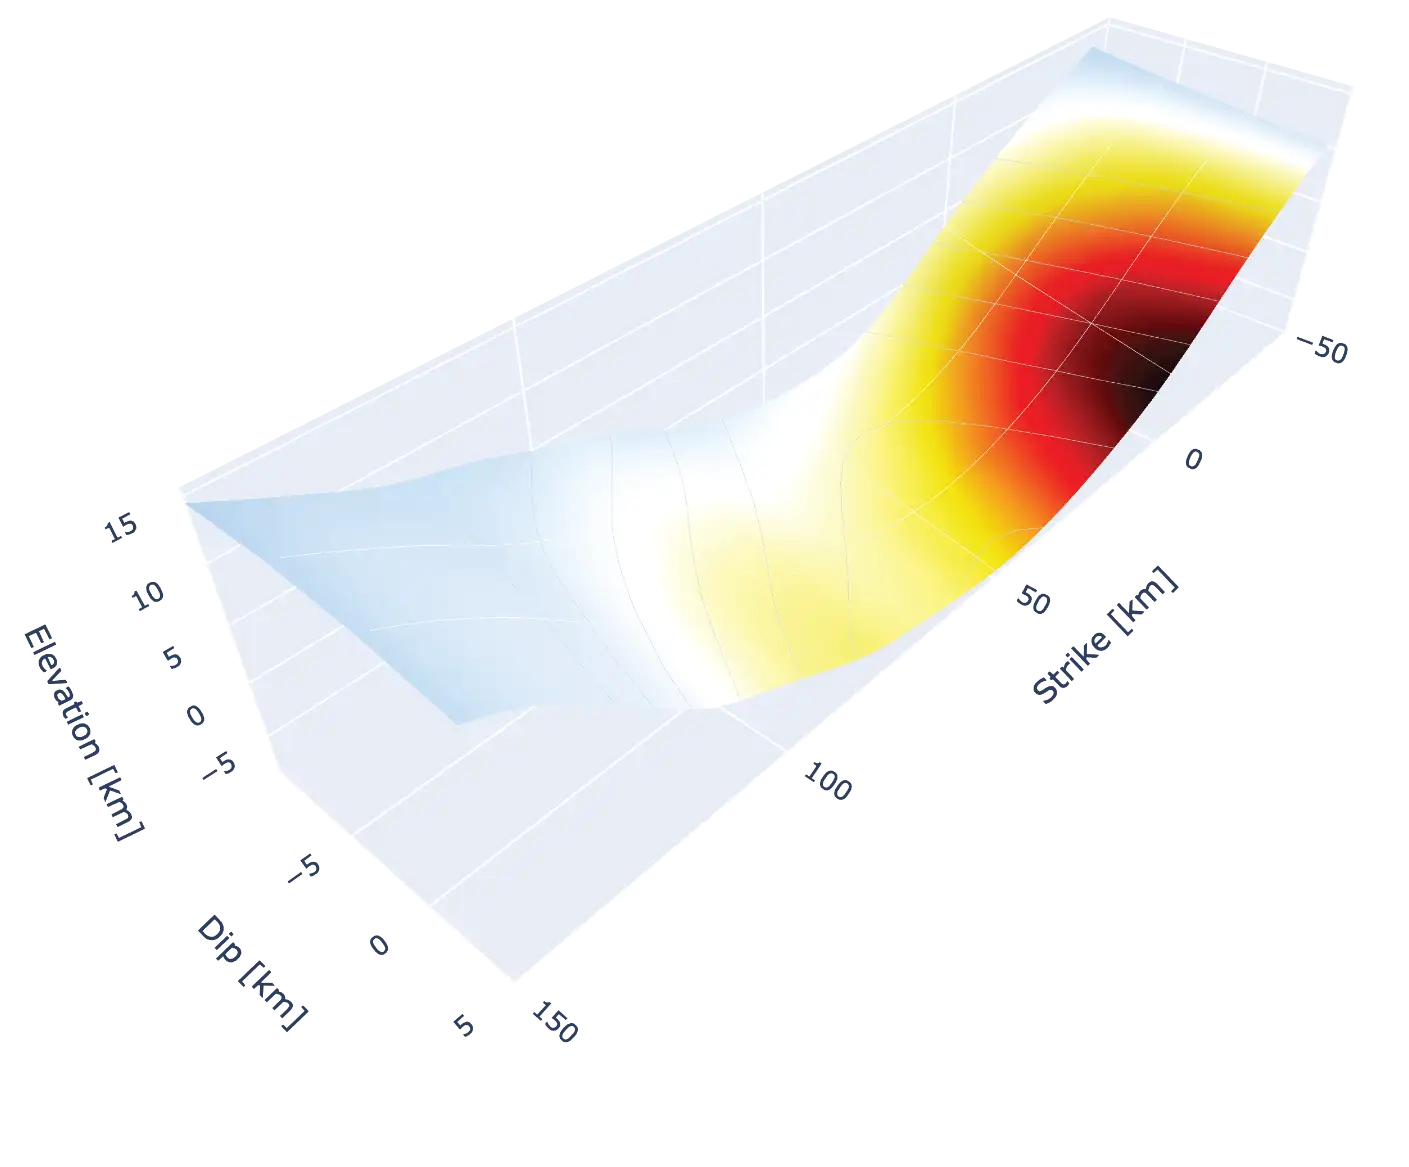
Liberation from the "planar" constraint. In PDTI, we do not fix the fault plane in advance. By investigating subsurface deformation exactly as the data dictates, we can simultaneously map both the complex curved geometry of the fault and its slip distribution (potency density), as shown here (modified from Fig. 13 in Sato, Yagi et al., 2026).
Depicting Earthquake Individuality: Backward Rupture Propagation (Boomerang Earthquakes)
A "returning" rupture that defies common sense. This illustrates "backward rupture propagation," where the rupture front sweeps back toward the epicenter like a boomerang (Inoue, Yamaguchi, Yagi et al., 2025). This visualizes new insights that were only reachable because PDTI enables stable analysis of strike-slip earthquakes.
No two earthquakes are exactly alike. PDTI is our new lens for understanding the unique "individuality" of each one.
Learn More: Technical Aspects of PDTI
In Potency Density Tensor Inversion (PDTI), rather than geometrically fixing the fault plane, we directly estimate the tensor components of the potency density at each grid point. This allows us to extract variations in fault strike and dip directly from the data during the rupture process.
Message from Yagi Lab
Our challenge over the past decade has been, in essence, a journey to increase the "resolution of earthquakes." Knowing the exact rupture process is an indispensable step toward predicting future earthquake damage and deepening our fundamental understanding of the Earth.